

Spinlocks, When To Worry About Them and Solutions To Common Problems
- CPU utilization is high
- Spins are of the order of billion
- The workload is OTLP oriented ( most of the time ).
- Your server has at least two CPU sockets, with eight physical cores in each under an intense OLTP workload, this is based on my the research behind my Super Scaling Singleton Insert blog, when pushing my server to its limits with conventional logging spinlock activity was not an issue:

nor was it an issue with the best throughput I could obtain using delayed durability:

The comment about eight cores per socket is based on the fact that with six cores per socket and two sockets I was unable to create any spinlock pressure of note. This does not preclude the fact you might have an application which is abusing the database engine or have encountered a SQL Server bug which is causing spinlock pressure.
Is there a threshold which should trigger off a spinlock investigation ?
If I was pressed to come up with a spin percentage of CPU cycles threshold for triggering concern into spinlock activity, I would say that this is 5% as a bare minimum. However, above and beyond this you really need to take into account the type of spinlock undergoing heavy spin and backoff activity. Under certain workloads high CPU utilization by certain spinlocks cannot be avoided.
General Hardware Advice
- When buying hardware to run SQL Server at scale, go for processors with the fastest clocks available, the faster that single threads can run.
- If you are you consolidating multiple instances and workloads onto a server with more than one CPU, try to avoid configuring instances that cross NUMA boundaries, this saves the expense (in terms of latency) of spinlocks having to travel between NUMA nodes via the quick path interconnect.
- Check that your hardware has all the latest and relevant firmware updates so that the quick path interconnect is working as efficiently as possible.
Spinlock “Usual suspects”
The topic of transaction log write tuning is worthy of a dedicated blog post in its own right. At scale getting low latency transaction log writes goes beyond the blanket statement of “Put your transaction logs on fast storage”:

Image adapted from material borrowed from Thomas Kejser with his permission. LOGCACHE_ACCESS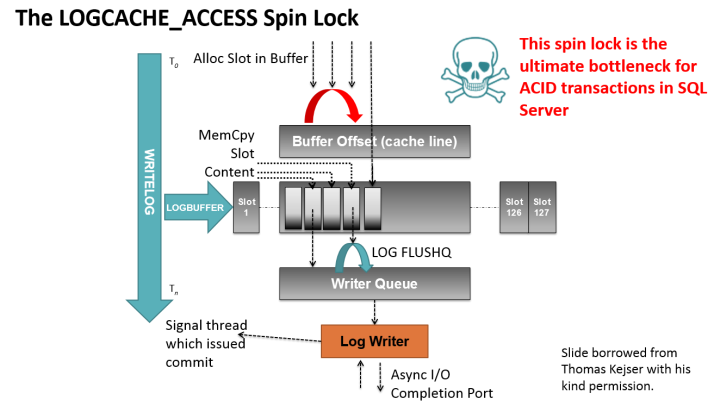

This governs thread access to the log buffer, in tests conducted by Microsoft on OLTP systems under load, up to 20% of a server’s CPU utilization can be expended on this one spinlock, solutions to this include:
- Minimizing the amount of time this spinlock is held for by reducing the amount of logging generated.
- Removing the CPU core that the log writer is using from the CPU affinity mask, this will be core 0 on either NUMA node 0 or 1.
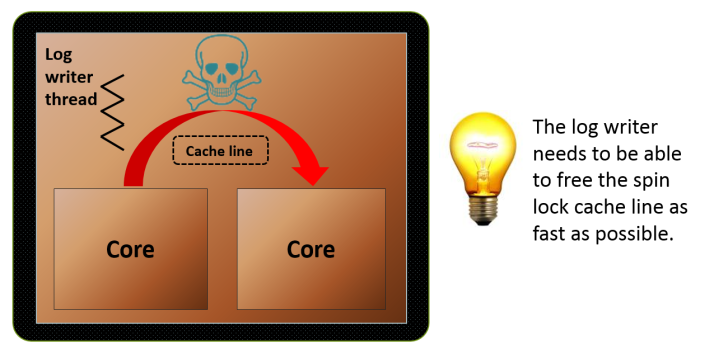
- Isolate the workload to the socket the log writer is running on, a spinlock manifests in memory as a cache entry. Any thread not co-located on the same NUMA node as the log writer will have to acquire the LOGCACHE_ACCESS spinlock via the quick path interconnect, the latency of which is much higher than L3 cache core to core transfers:


This spinlock is the ultimate bottleneck for any OLTP application that uses SQL Server and is used irrespective of whether or not the in-memory ( Hekaton ) engine is used or not.
LOGFLUSHQ
When a commit takes place this spinlock is acquired and held until the logging information for the relevant transaction has been copied into the write queue. Heavy spin and back off activity on this spinlock may indicate:
- The IO sub system cannot drain the write queue as fast as it is being filled.
- You are hitting the log writer pending IO limit; 32 prior to Server 2012 and 112 from SQL Server 2012 on-wards.
Last Resort Options For Relieving Pressure On Logging Related Spinlocks If all conventional options for relieving pressure on the transaction log write spinlocks have been tried, there are only really two options available left on the table:
- ‘Shard’ the database(s) between SQL Server instances By doing this you are effectively partitioning the database across multiple log writer threads.
- Use SQL Server 2014 delayed durability The operation of a ‘Commit’ is decoupled from the logging information being written to disk, this only takes place once a full 60K portion of the log buffer is filled. I have seen this completely eliminate WRITELOG waits, however, it comes come at the risk of causing potential data loss.
XDESMGR
This protects the database engine mechanism which deals out transaction ids, relieving pressure on it is achieved by executing multiple DML statements per transaction or using table value constructors such that single INSERT statements can insert multiple rows.
OPT_IDX_STATS
Access to the internal data structures associated with sys.dm_db_index_usage_stats and sys.dm_db_missing_index_stats is governed by this spinlock, it can be turned off by using trace flag 2330.
LOCK_HASH
When there is heavy and sustained access to a bucket in the lock manager hash table, a high number of spins and back offs are likely to be seen on this spinlock. Resolutions to this include:
- Monitoring lock escalation The coarser grained a lock is the higher contention is likely to be on the hash bucket containing the lock, although this may not necessarily be directly behind heavy spin and back off activity on this spinlock, it will exacerbate the problem.
- Turning off page level locking Same comment regarding lock granularity applies.
- Keeping transactions as short as possible.
- Checking that the application is not causing multiple sessions to update the same row by design.
- If multiple readers are reading the same row, consider using the NOLOCK hint or changing the isolation level to a version of read committed snapshot or serializable isolation levels which uses the row version-ing.
SOS_CACHESTORE
This spinlock synchronizes access to the plan cache hash buckets. The use of object names which are not fully qualified will result in a search of the user’s default schema which is a longer code path and results in a greater number of spins on this spinlock.
SOS_OBJECT_STORE
Activity on this spinlock manifest during heavy insert activity and is associated with the locks taken out by the insert. This mind map illustrates how the link between SOS_OBJECT_STORE and the locks acquired by the insert is made:

Image adapted from material borrowed from Thomas Kejser with his permission.
For OLTP insert activity, consider turning off page level locking off on the object being inserted into by creating a clustered index on the object with ALLOW_PAGE_LOCKS=OFF (or altering it if it already exists):
1
2
3
| CREATE CLUSTERED INDEX ciON dbo.MyTable (c1)WITH (ALLOW_PAGE_LOCKS = OFF) |
This spinlock can become a problem during bulk load activities which there is a subtly different solution for:
1
2
3
4
5
| CREATE CLUSTERED INDEX ciON dbo.MyTable (c1)WITH (ALLOW_ROW_LOCKS = OFF, ALLOW_PAGE_LOCKS = OFF) ALTER TABLE dbo.MyTable SET (LOCK_ESCALATION = AUTO) |
If the object can be loaded by more than one bulk load simultaneously and each bulk load ‘Stream’ can be isolated to a specific partition, the clustered index should be partition aligned with the heap:
1
2
3
4
5
6
| CREATE CLUSTERED INDEX ciON dbo.MyTable (c1)WITH (ALLOW_ROW_LOCKS = OFF, ALLOW_PAGE_LOCKS = OFF)ON [MyTable](PartitionKey)ALTER TABLE dbo.MyTable SET (LOCK_ESCALATION = AUTO) |
Wrap Up
I have covered some of the spinlocks ubiquitous with high CPU utilization problems. However, the raw data obtained from sys.dm_os_spinlock_stats has to be put into context of the workload type and the spinlock experiencing high spin and back off activity. Problems with some spinlocks such as LOCK_HASH should be fixable most of the time, other spinlocks such as LOGCACHE_ACCESS may cause high CPU utilization when the database engine is under a sustained OLTP workload which cannot be avoided due to the nature of the beast that is . . . the database engine.
No hay comentarios.:
Publicar un comentario